5 KPIs to Track After Deploying a Visa Management Platform

Want Proof Your Visa Platform Is Working? Measure What Matters
Everyone loves the promise of a one-click visa experience: higher conversion, happier travelers, fewer headaches for your team. But once you have rolled out a visa management platform such as SimpleVisa, the real question becomes “Is it actually delivering?”
Below are five key performance indicators (KPIs) that leading travel brands track after go-live. Monitor them consistently and you will know—within weeks—whether your new workflow is improving the traveler journey and strengthening the bottom line.
1. Visa-Related Conversion Rate
What it is
The percentage of eligible passengers who add a visa to their booking through your platform (or white-label app) instead of clicking away to apply on their own.
Why it matters
Every lost conversion is a double loss: the traveler still needs a visa, but you surrender both control of the journey and potential ancillary revenue. Conversion rate is a direct measure of how well your call-to-action, price point, and overall user experience persuade customers to complete the application inside your ecosystem.
How to track
- Log the number of visa offers shown vs. visa applications initiated and completed.
- Break the data down by origin–destination pair, device type, and language.
- Benchmark against pre-implementation figures, or—if you previously offered no integrated solution—against industry averages published by IATA or UNWTO (typical on-site add-on take-up for ancillaries is 6–15 %).
Quick win
A/B test explanatory micro-copy (“eVisa in 10 min, 95 % approved”) near the call to action. Simple wording tweaks often lift conversion by 3–5 % within a single sales cycle.
Further reading: 3 benefits of a travel visa document systems
2. Ancillary Revenue per Booking (ARPB)
What it is
Total visa-related revenue divided by total passenger segments booked. In other words, how much extra you earn per traveler thanks to the new service.
Why it matters
Airlines and OTAs frequently operate on razor-thin margins. Ancillaries—from seat selection to insurance—now account for 15–25 % of global airline revenue, according to IdeaWorksCompany 2024. A successful visa management platform should join that list of top performers.
How to track
- Extract net service fees and commission earned via your SimpleVisa API.
- Divide by total passenger segments in the same period.
- Compare month-on-month, noting seasonal swings (summer long-haul routes usually generate more visa income).
Industry benchmark
Travel brands that embed visa logic directly in the booking flow often see USD 3–7 ARPB six months after launch, with peaks above USD 10 on visa-heavy corridors (e.g., U.S. → India, U.K. → Kenya).
Quick win
Bundle the visa with high-touch ancillaries—think airport transfers or fast-track security—and position it as a “Complete Entry Pack.” This packaging can lift ARPB by up to 20 %.
3. Application Completion Time
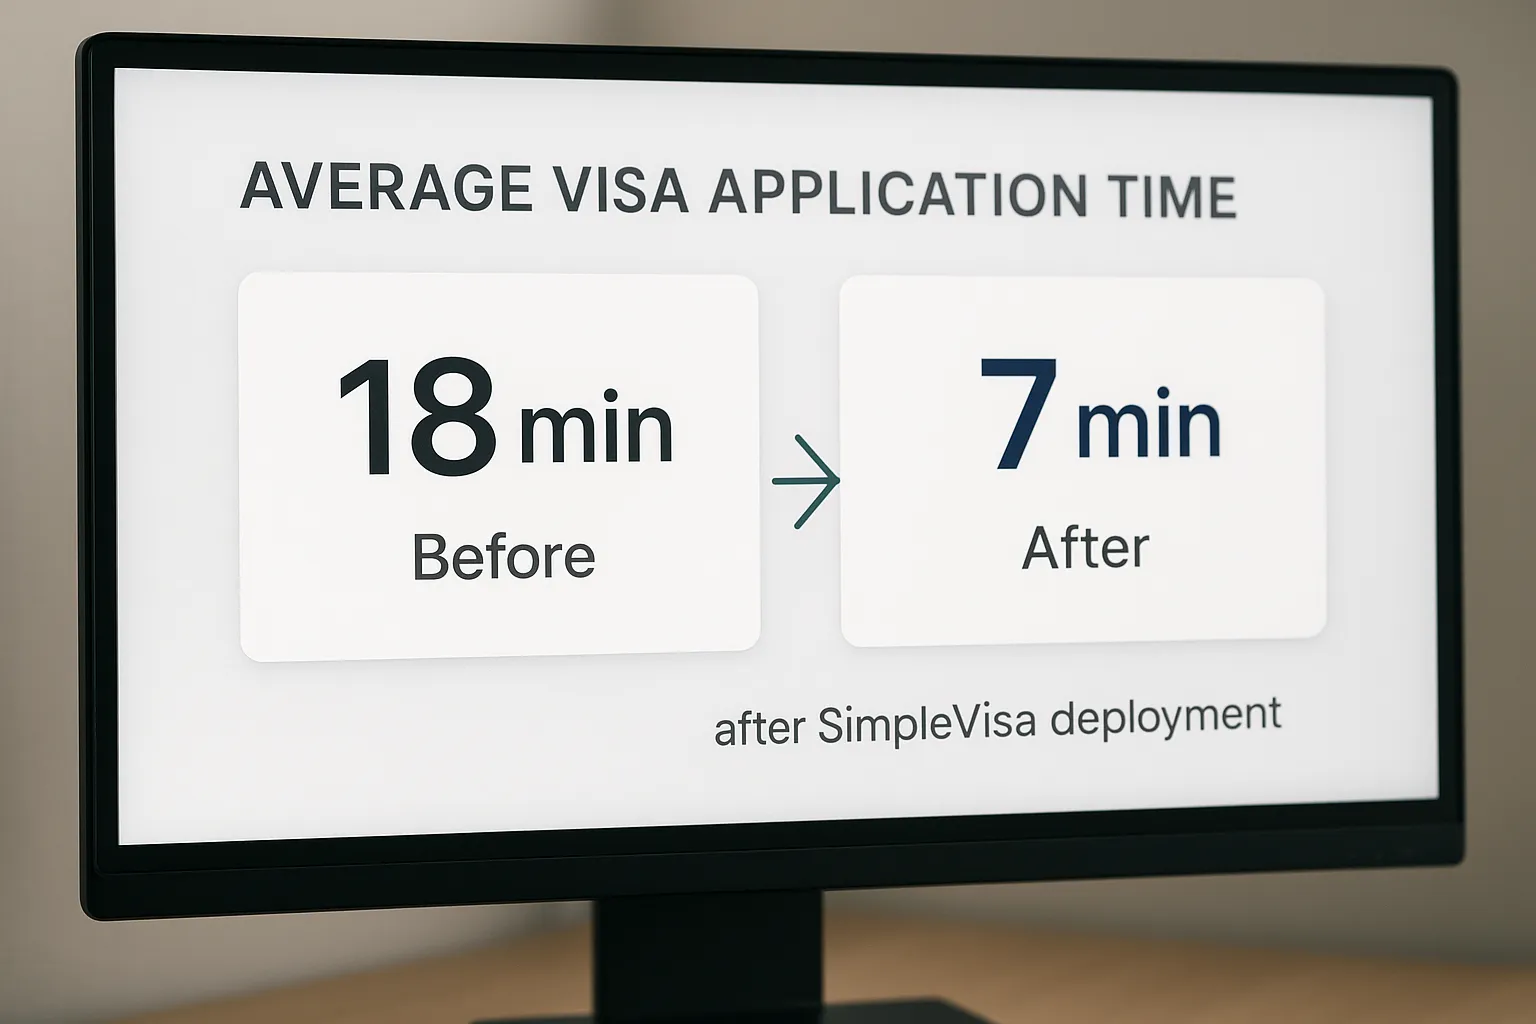
What it is
The average number of minutes it takes a customer to finish the application once they start.
Why it matters
Speed equals satisfaction. According to a 2023 Phocuswright survey, 54 % of travelers abandon ancillary check-out flows that exceed ten minutes. Faster forms also mean lower drop-off, fewer incomplete files, and, ultimately, higher approval rates.
How to track
- Use built-in timers or Google Tag Manager events to capture session start and submission timestamps.
- Report median and 90th-percentile times (the long tail often hides UX pain points).
- Compare across device types; mobile should not lag behind desktop by more than 20 %.
Target
Best-in-class platforms keep average completion under 8 minutes—less than half the time of legacy embassy portals.
Quick win
Activate auto-fill via your passenger name record (PNR) or loyalty profile to pre-populate passport data. SimpleVisa’s SDK supports this out of the box and can shave two to three minutes off the journey.
Related guide: How eVisa APIs work: Step by Step
4. Approval Rate
What it is
The share of submitted applications that receive a positive decision from the issuing government.
Why it matters
Higher approval means fewer refunds, reduced customer service load, and stronger trust in your brand. An uptick post-deployment indicates that your platform’s document checks, passport OCR, and real-time validations are doing their job.
How to track
- Leverage the webhook responses from your visa management platform—SimpleVisa returns status changes in real time.
- Segment by nationality, destination, and visa type to spot patterns.
- Monitor false positive failure rates (applications rejected because of data entry errors rather than eligibility issues).
Benchmark
Digitally assisted applications can push approval north of 97 % for mainstream destinations. If your figure sits below 90 %, investigate form guidance or photo upload quality.
Quick win
Enable in-form validation for passport expiry, photo dimensions, and prohibited characters. These lightweight guardrails typically raise approval by 2–4 % almost overnight.
5. Customer Satisfaction & Support Metrics

What they are
- Net Promoter Score (NPS) specific to the visa flow
- Support tickets per 1,000 applications
- Average handling time (AHT) for visa-related queries
Why they matter
A smooth visa journey boosts overall trip satisfaction and reduces costly human intervention. Fewer calls mean your agents can focus on high-value sales or complex cases.
How to track
- Send a short, automated NPS survey once the traveler receives their eVisa (SimpleVisa’s webhook can trigger your marketing automation platform).
- Tag all visa questions in Zendesk or Salesforce Service Cloud to isolate ticket volume and AHT.
- Compare to legacy manual processing periods.
Benchmarks
- Visa-specific NPS: +40 or higher is considered excellent.
- Tickets per 1,000 apps: best-in-class OTAs stay under 12.
- AHT: aim for <5 min thanks to template replies and embedded status look-ups.
Quick win
Add a self-service “Where is my visa?” tracker inside your mobile app. SimpleVisa’s status API lets travelers pull real-time updates without contacting your call center, cutting tickets by up to 30 %.
See also: Visa Processing: 4 Efficient and Successful Tips
Putting It All Together: Build a KPI Dashboard in One Afternoon
- Connect your SimpleVisa account to a business intelligence tool—Looker, Power BI, or even Google Data Studio.
- Pull raw events via the platform’s REST API or webhook logs (application_created, application_submitted, status_updated, payment_captured).
- Model the metrics above, set weekly or monthly targets, and visualize trends.
- Automate alerts (Slack, email) when a KPI deviates by >10 % from the baseline.
Not ready for a full BI stack? Start simple: export a CSV from the SimpleVisa dashboard every Friday and plot the five KPIs in a shared Google Sheet. Consistency beats complexity.
Final Thoughts
Deploying a visa management platform is not a “set it and forget it” project. The true value emerges when you measure, iterate, and optimize around the KPIs that align with your commercial and customer-experience goals.
Focus on these five indicators:
- Visa-related conversion rate
- Ancillary revenue per booking
- Application completion time
- Approval rate
- Customer satisfaction & support load
Track them rigorously, share insights across product, marketing, and operations teams, and you will turn your new visa service from a checkbox feature into a strategic revenue engine.
Ready to see these metrics live? Request a SimpleVisa demo and learn how quickly you can start moving the needles that matter.